Propeller Acoustics
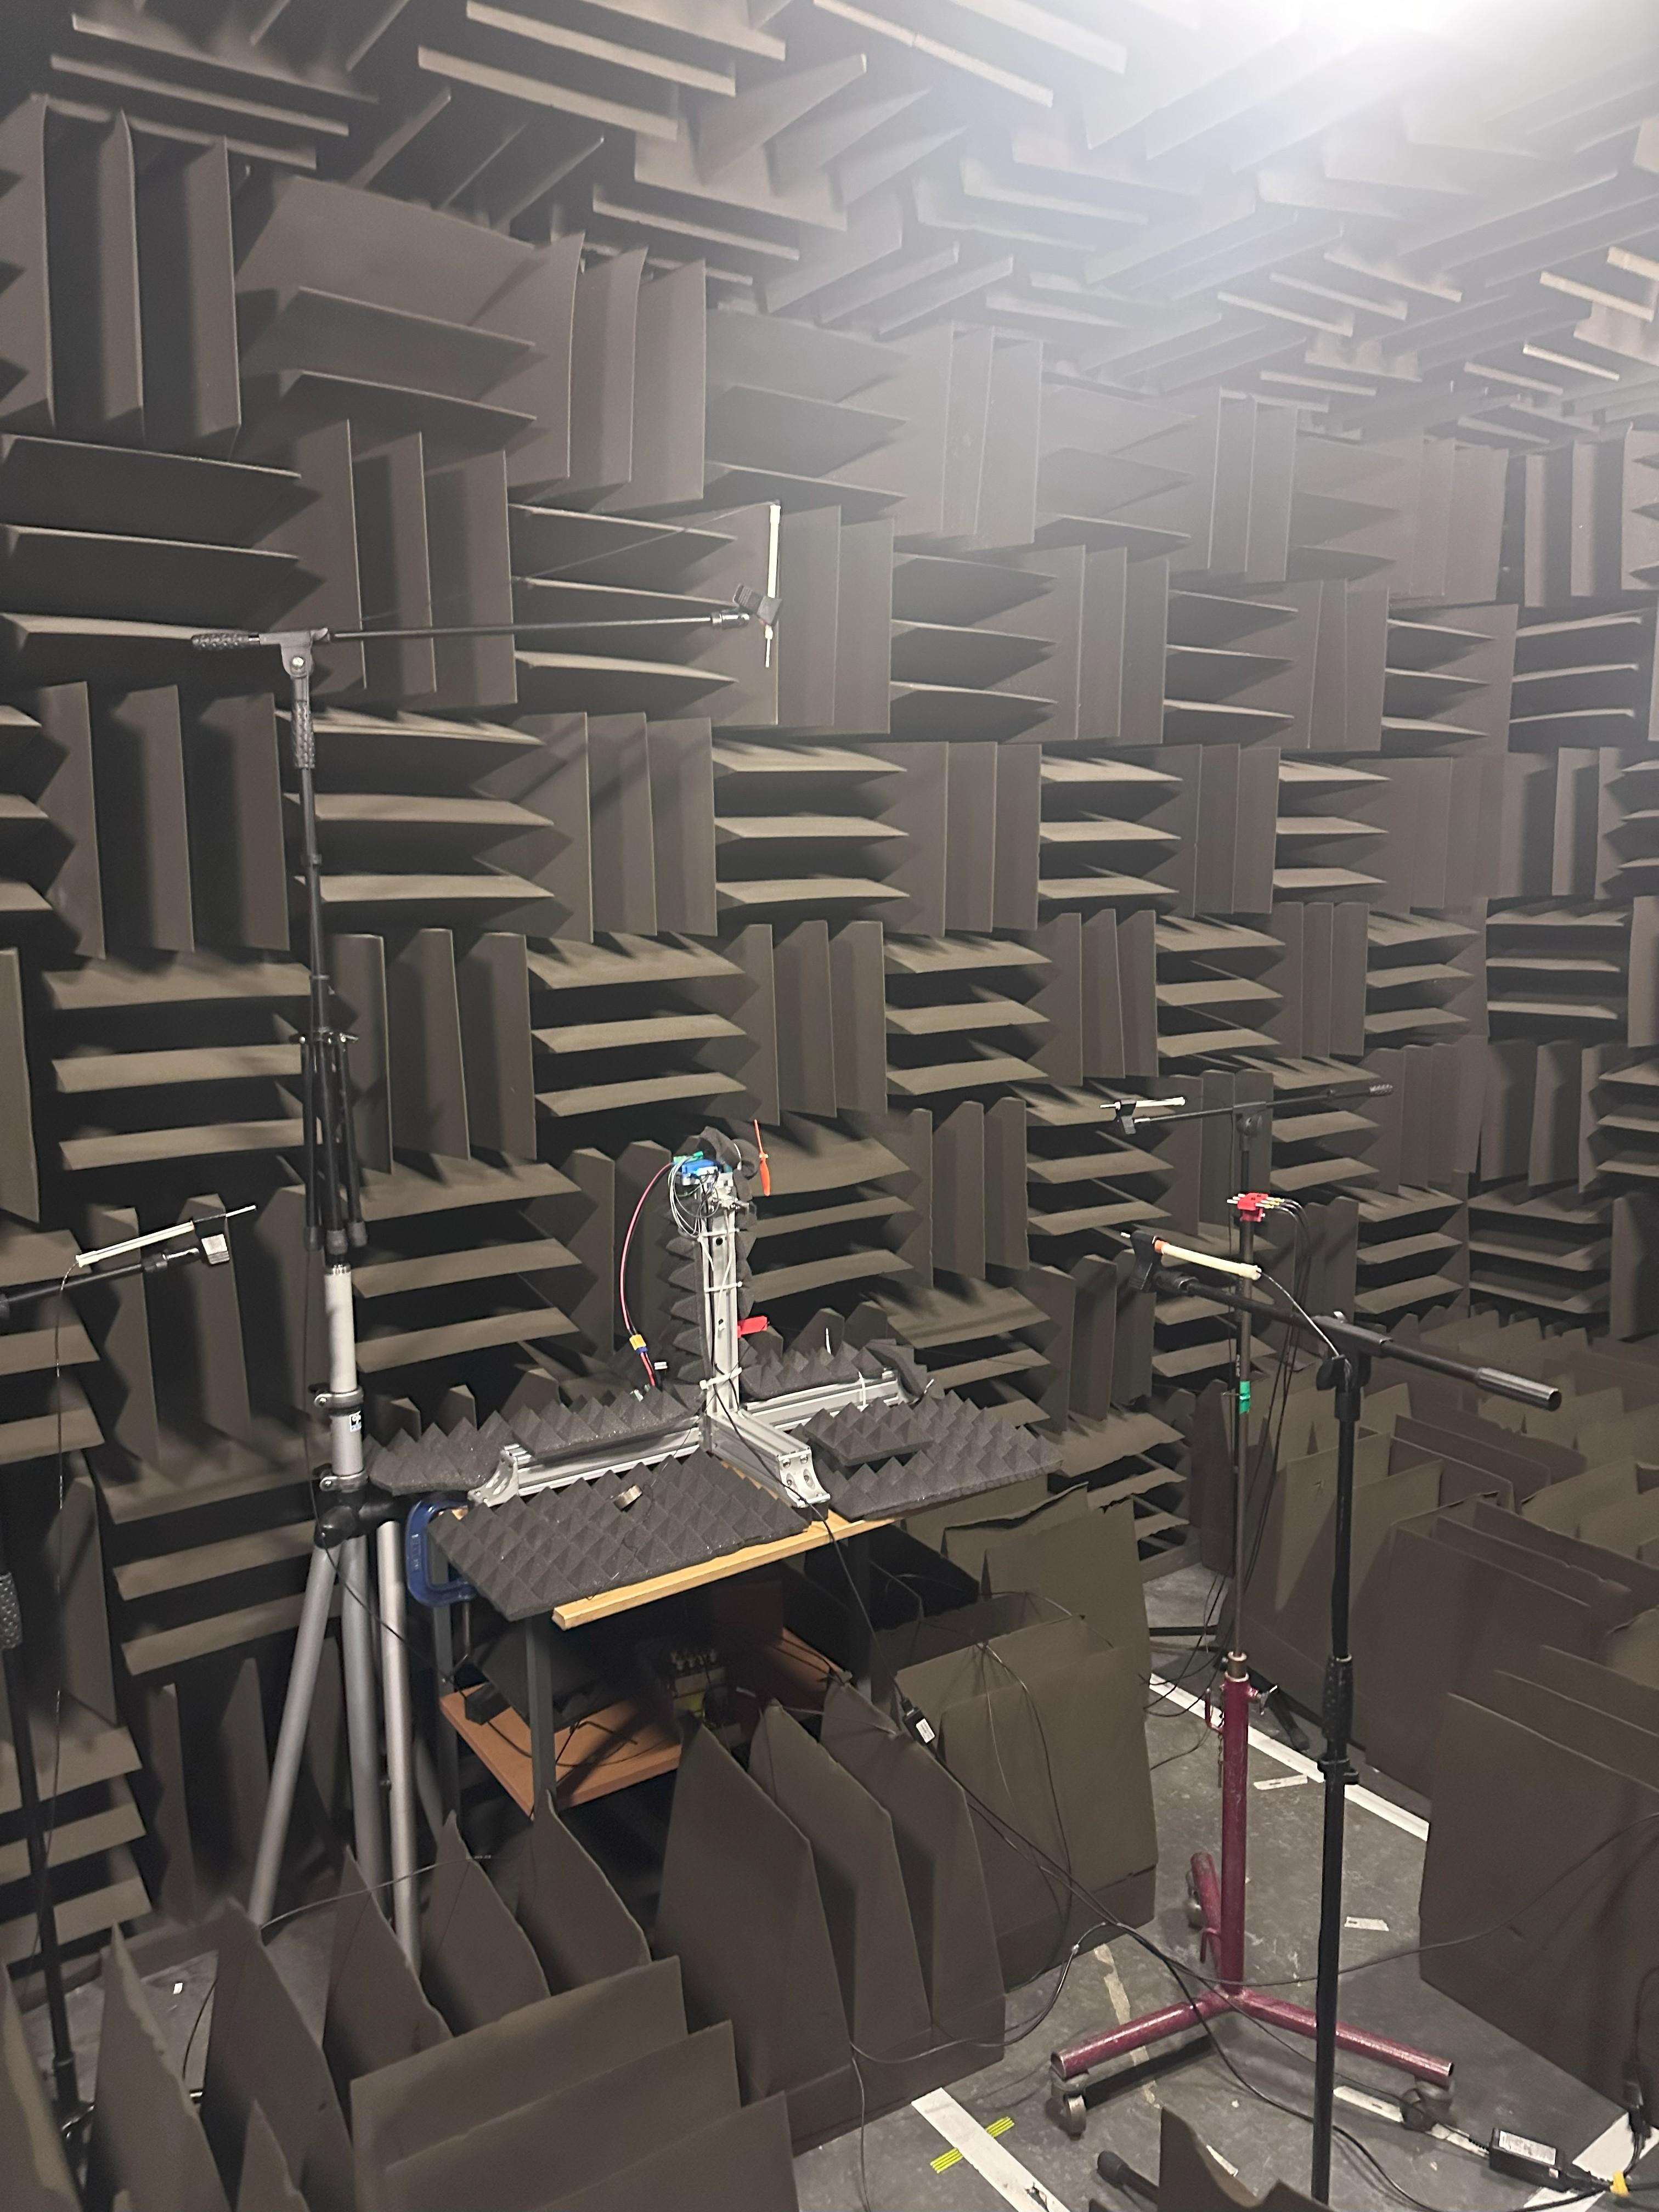
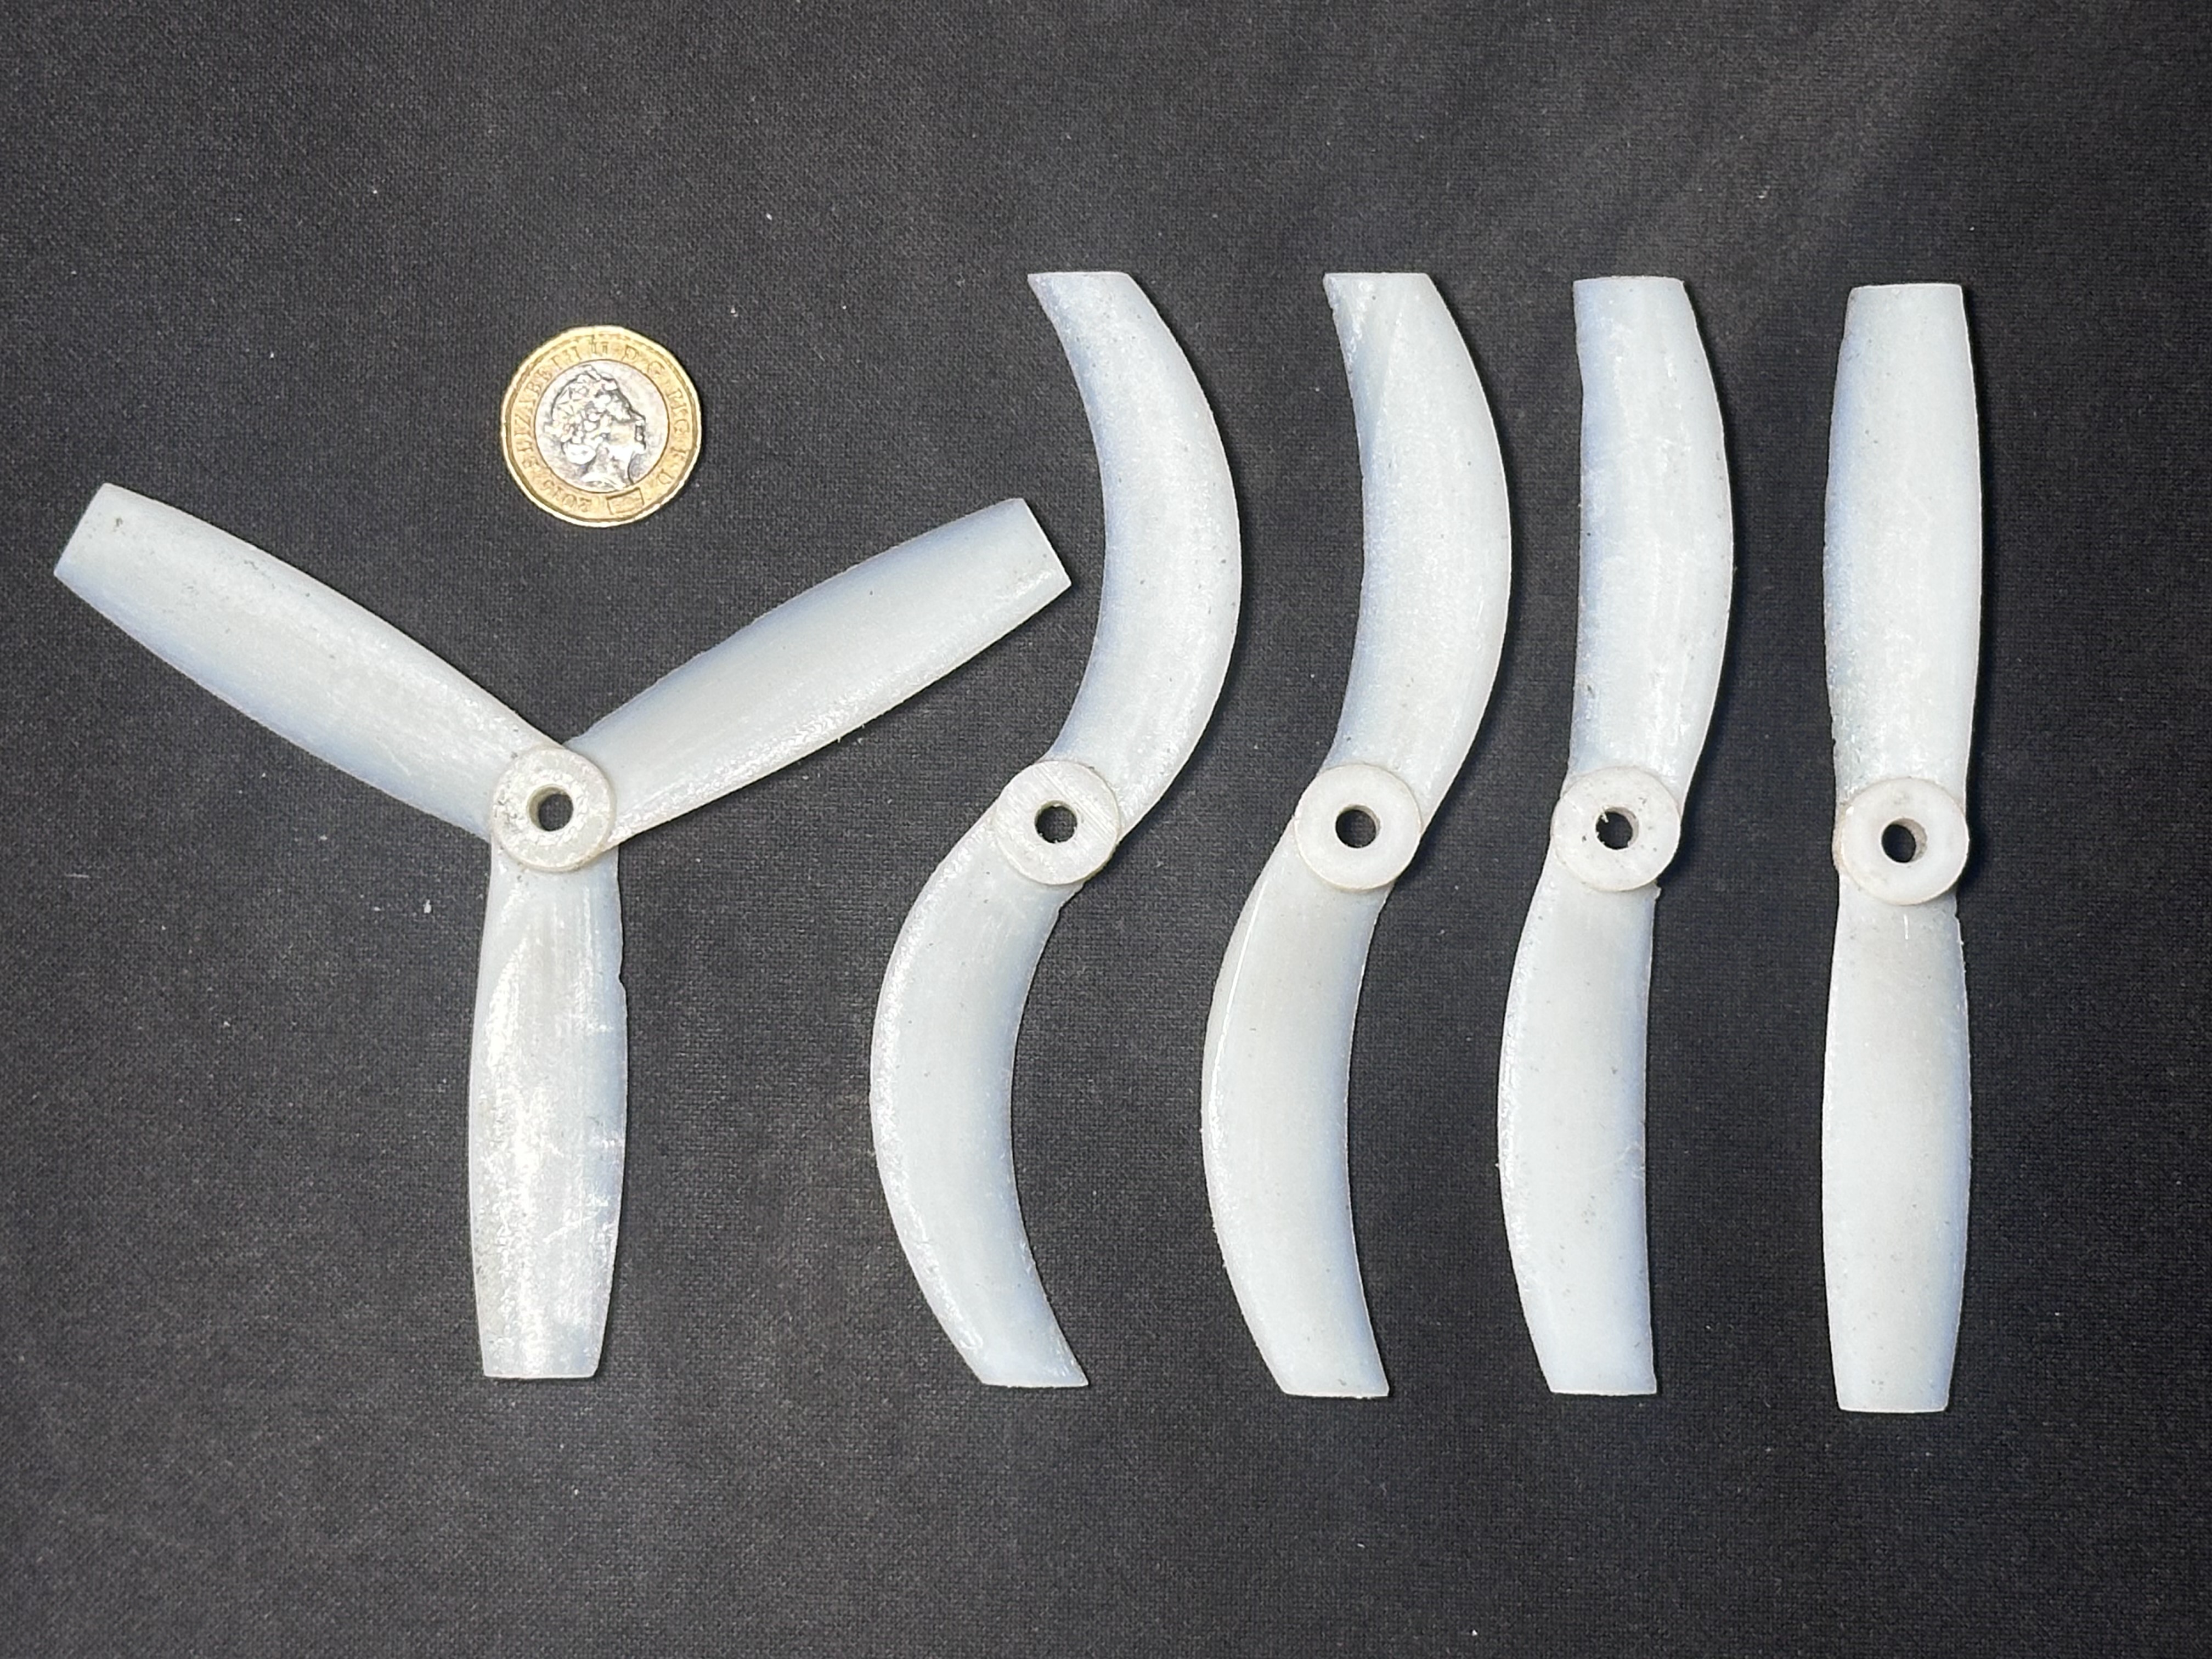
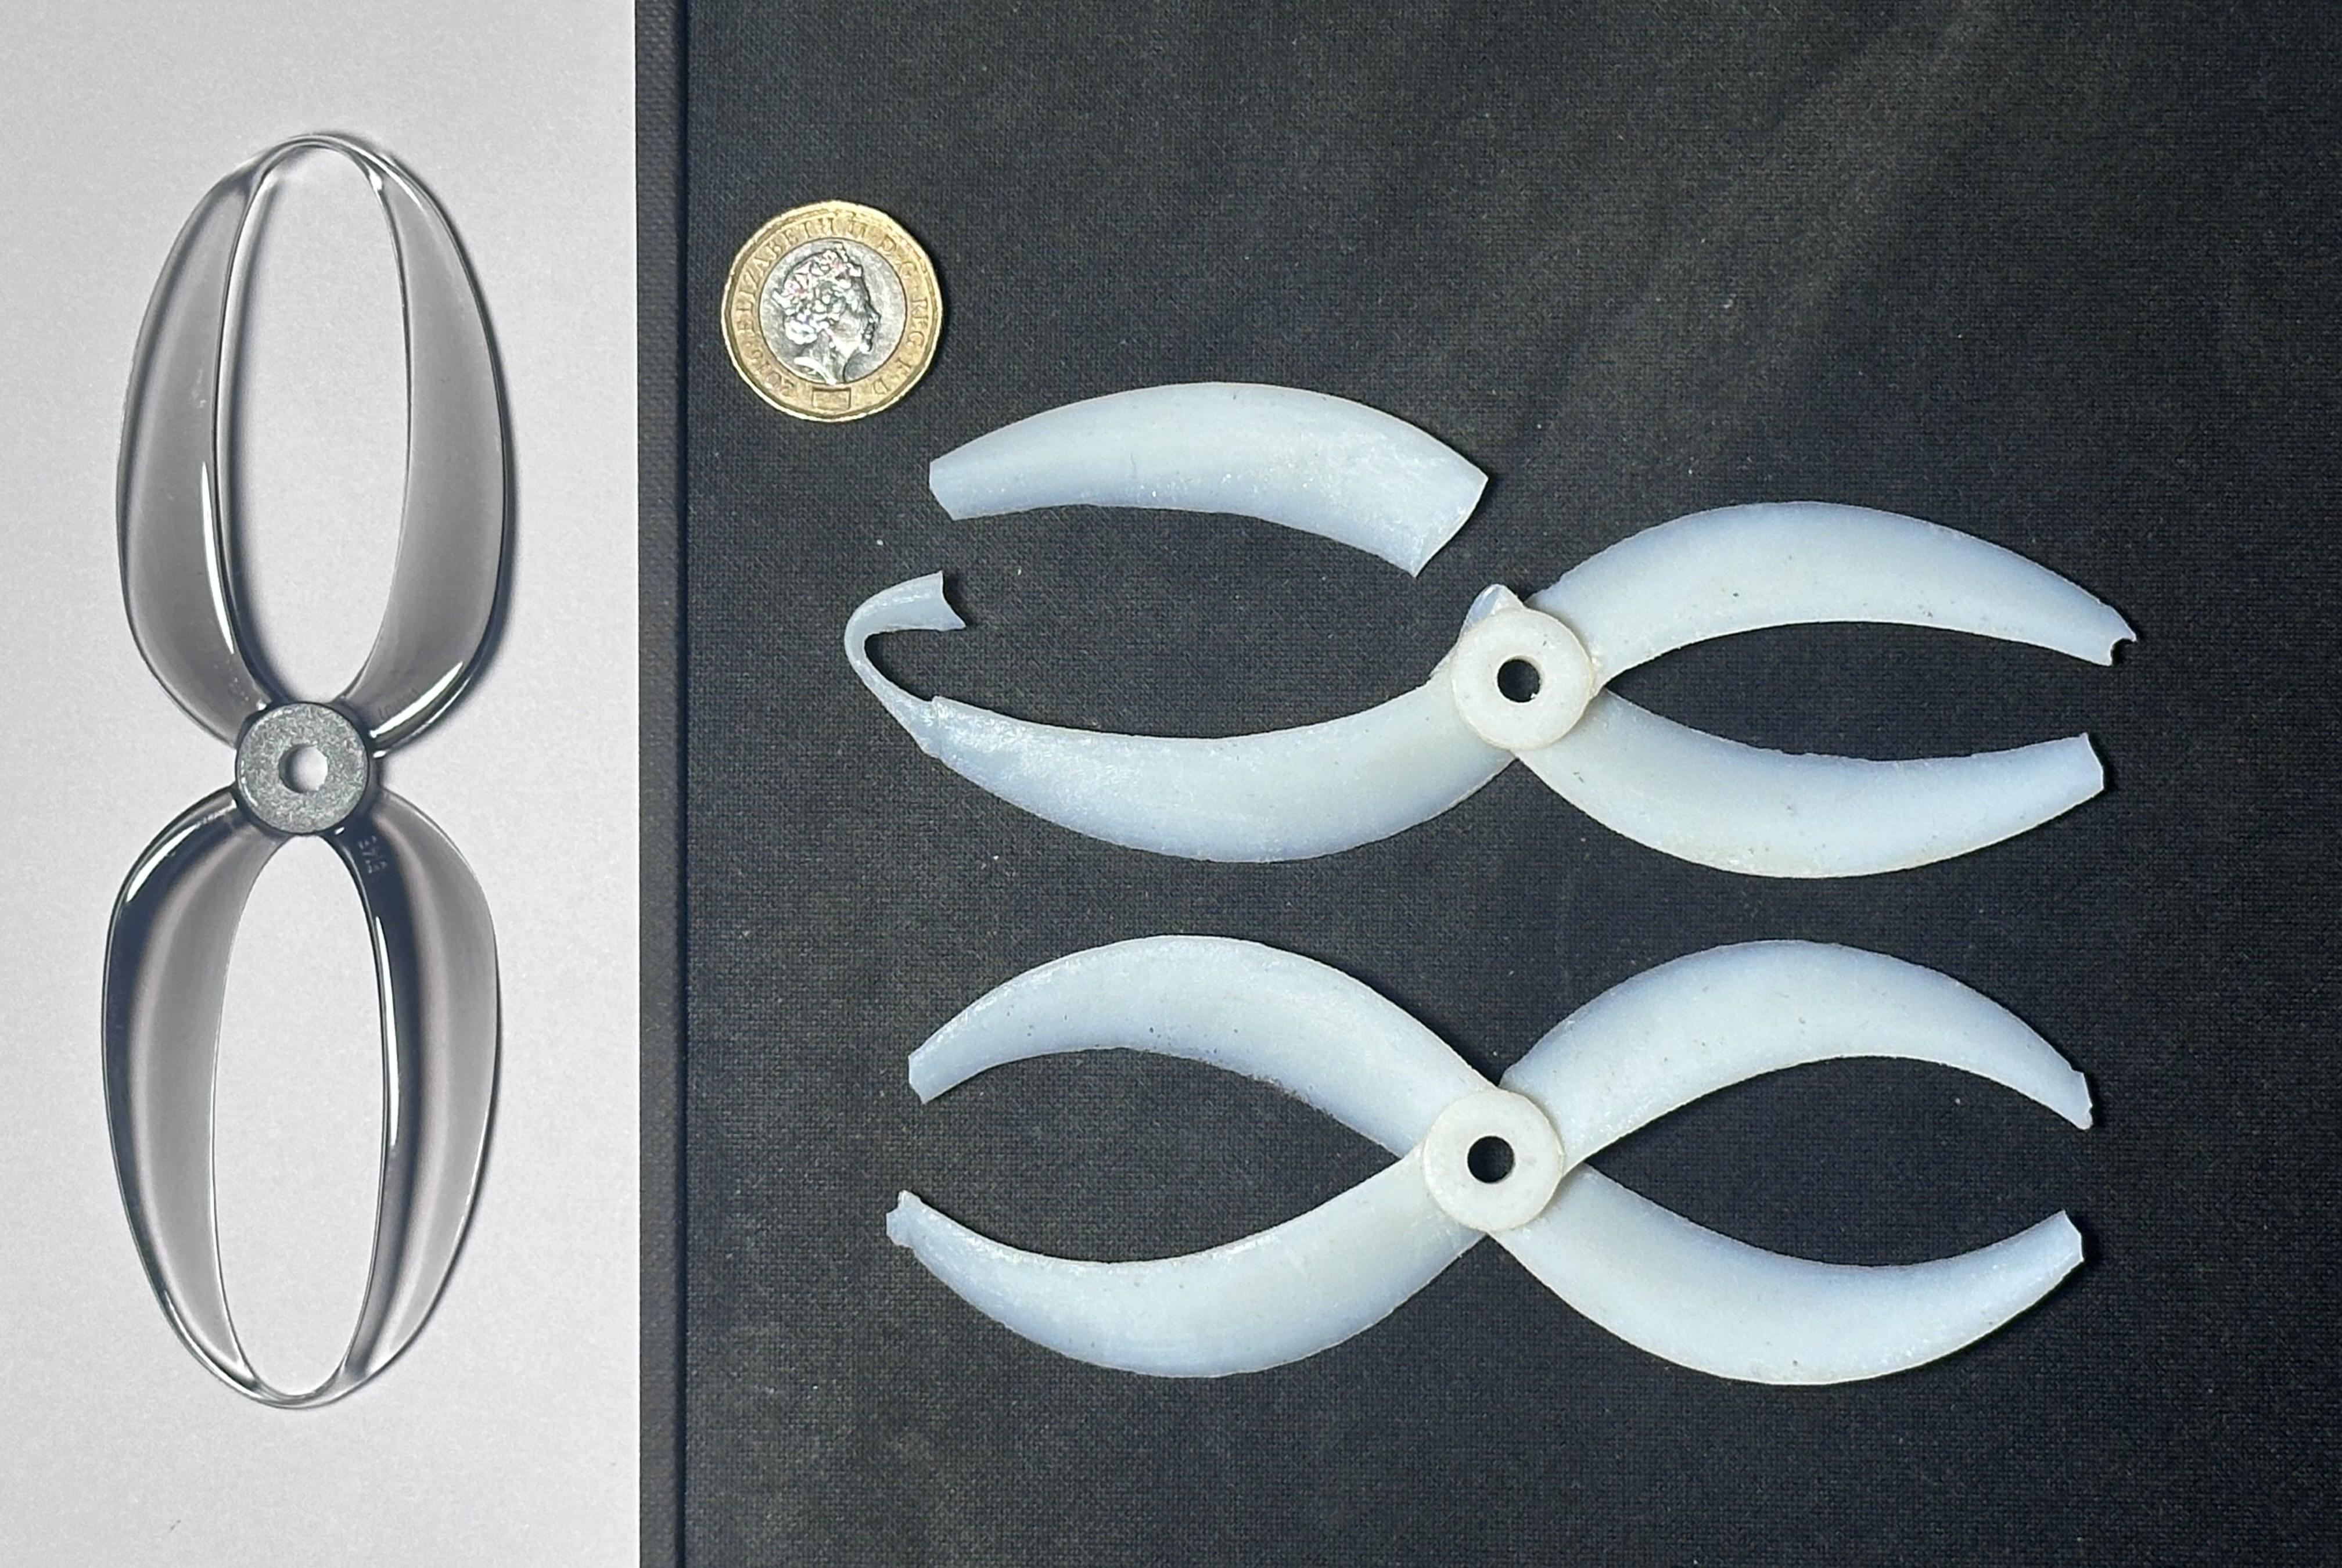
As drones become increasingly integrated into commercial and urban environments, their acoustic signatures has emerged as a barrier to public acceptance and regulatory approval. Propeller noise, often tonal and high-pitched, reaches high psychoacoustic annoyance factors and has proven difficult to mitigate without compromising aerodynamic performance. This report compares two promising blade geometries—blade sweep and toroidal (looped) designs—for reducing propeller noise while maintaining efficiency. To enable fair comparisons, acoustic metrics are scaled to fixed reference thrust and torque coefficients using an effective radius and tip speed. Experiments were conducted in an anechoic chamber using custom-built rigs to measure thrust, torque, and far-field sound pressure levels for a range of 3D printed propeller geometries. Strong agreement was found between measured aerodynamic performance and theoretical power-law scaling with speed. Similarly, acoustic measurements followed expected scaling with distance and tip speed Among the tested designs, both swept and certain looped blades achieved reduction in overall noise; however, these were offset by reductions in aerodynamic efficiency. The quietest propeller overall was the largest tested, despite the dimensionless analysis.

Key points of work:
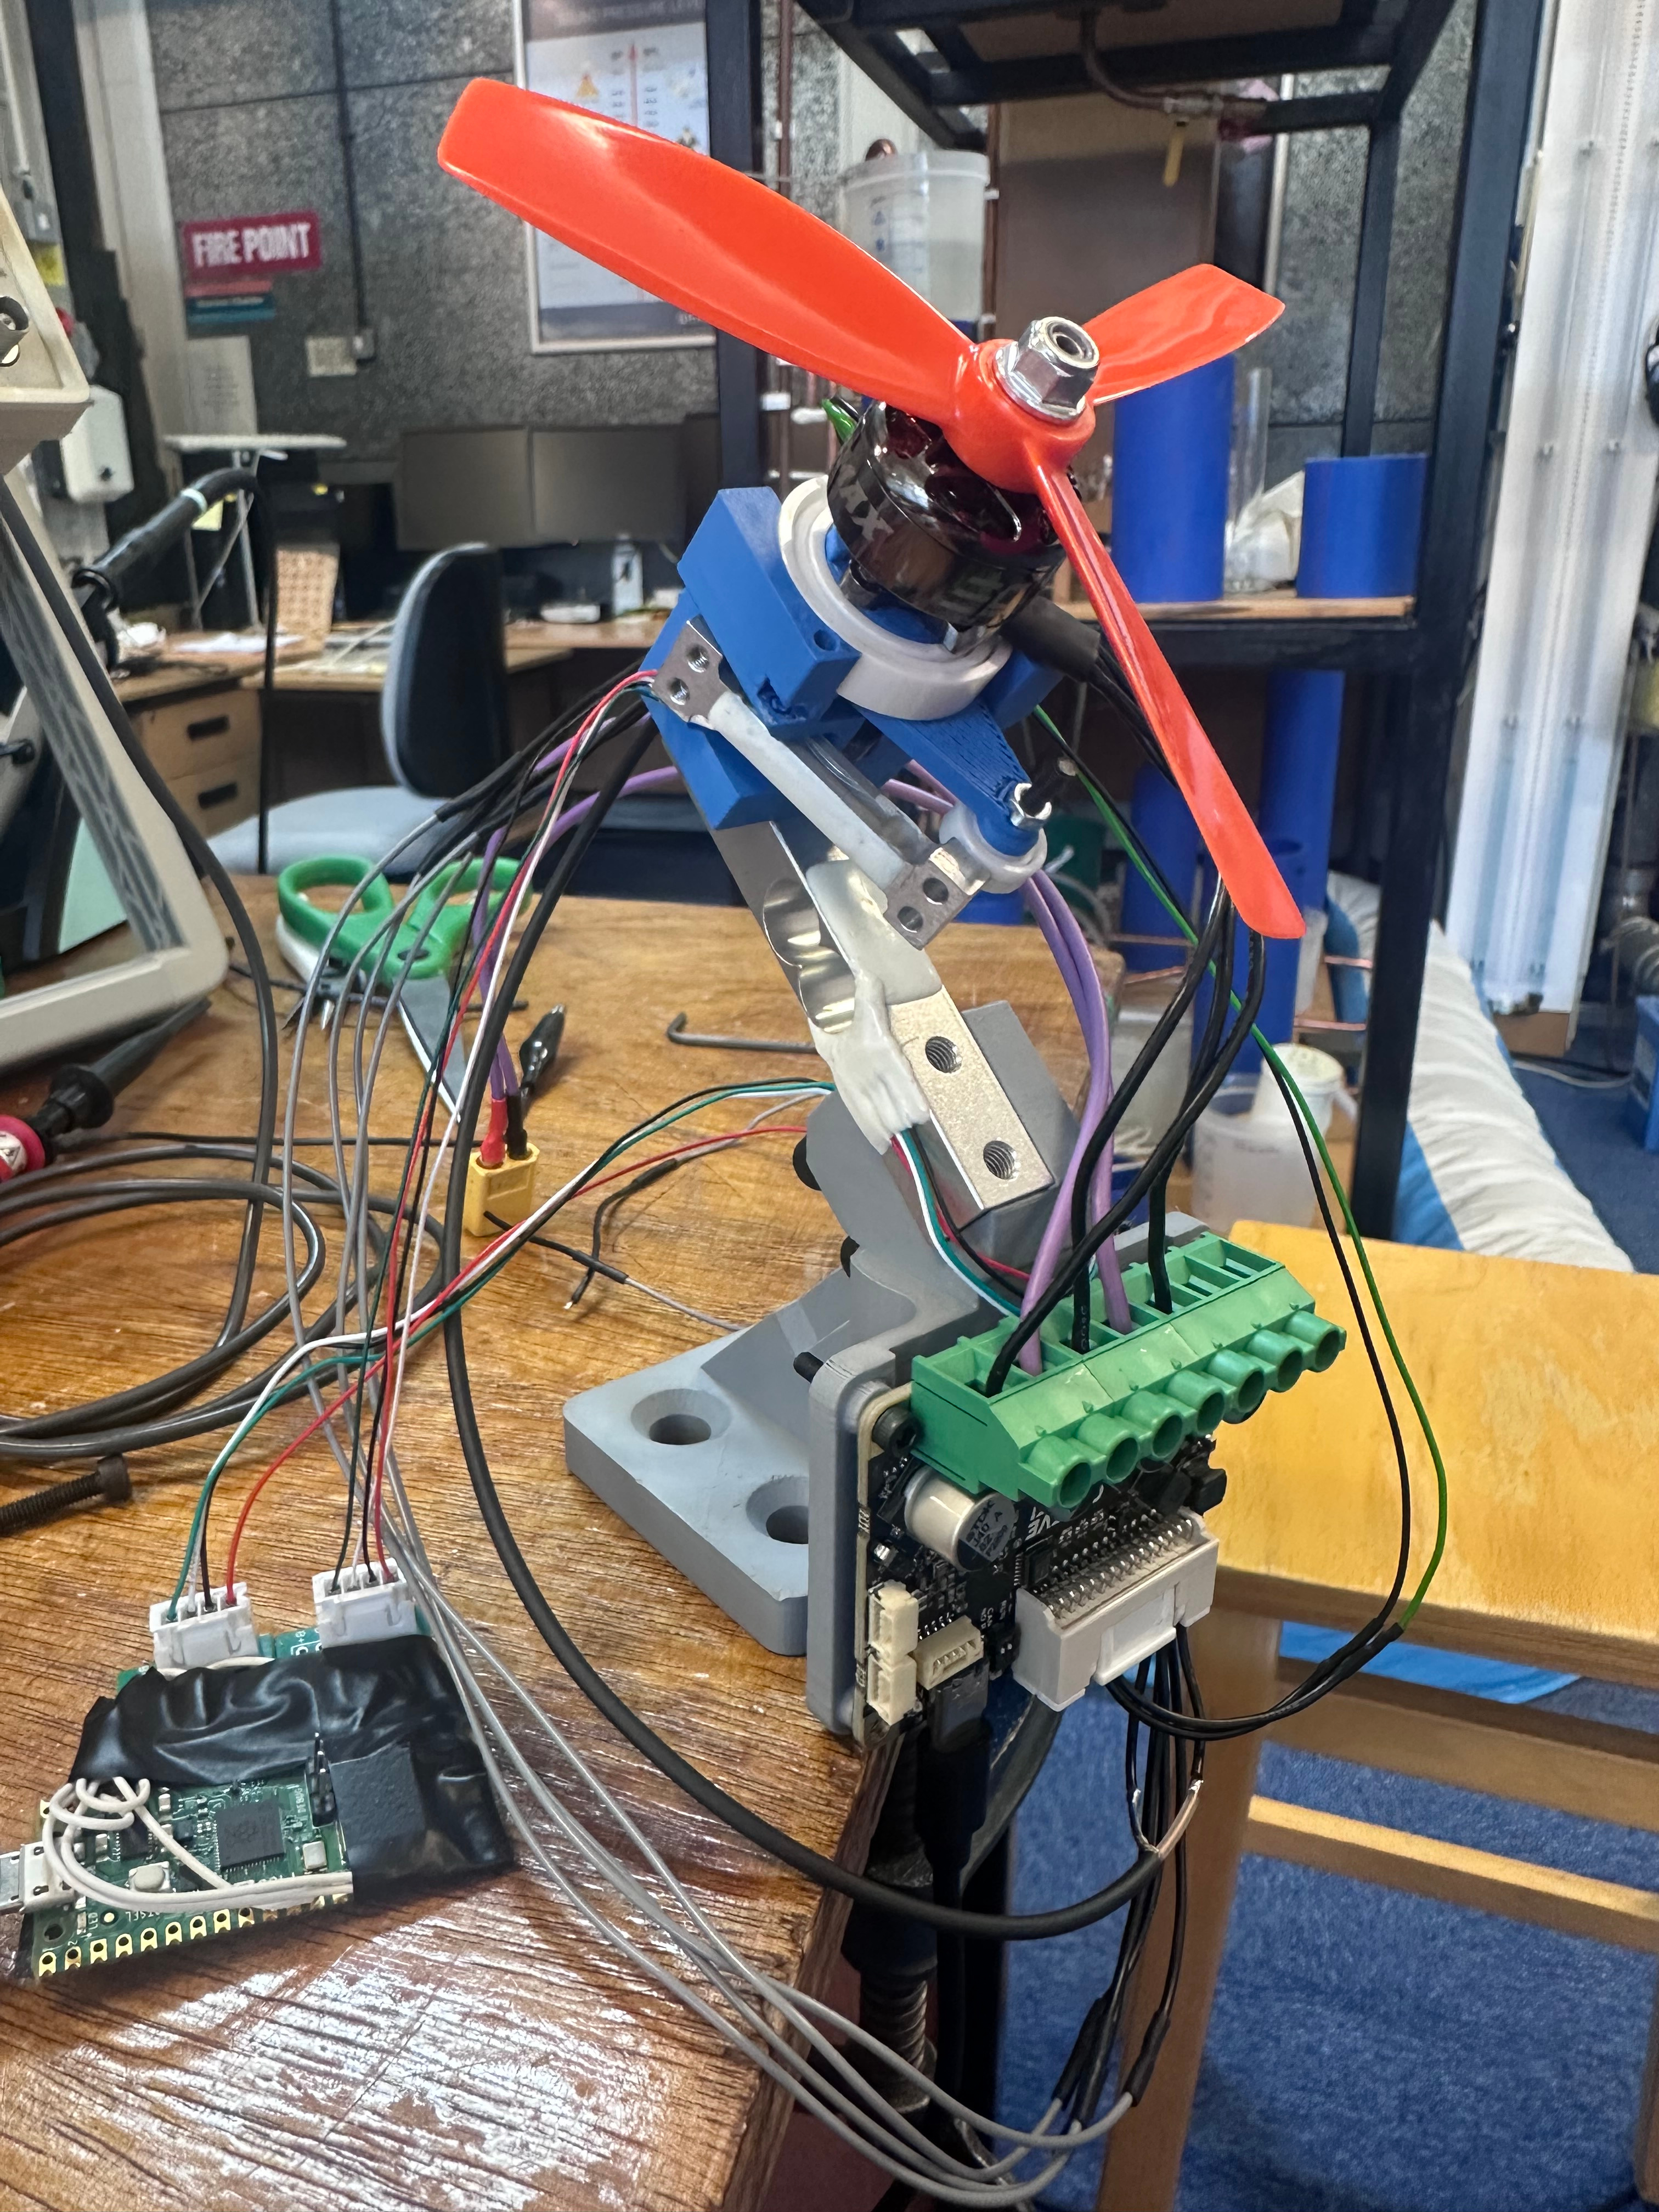
- Designing two experimental rigs to measure aerodynamic and acoustic performance, isolating propeller noise from motor noise, and ensuring consistency between setups.
- Audio processing including reducing spectral leakage and the discrete integration of harmonics to capture broadened peaks.
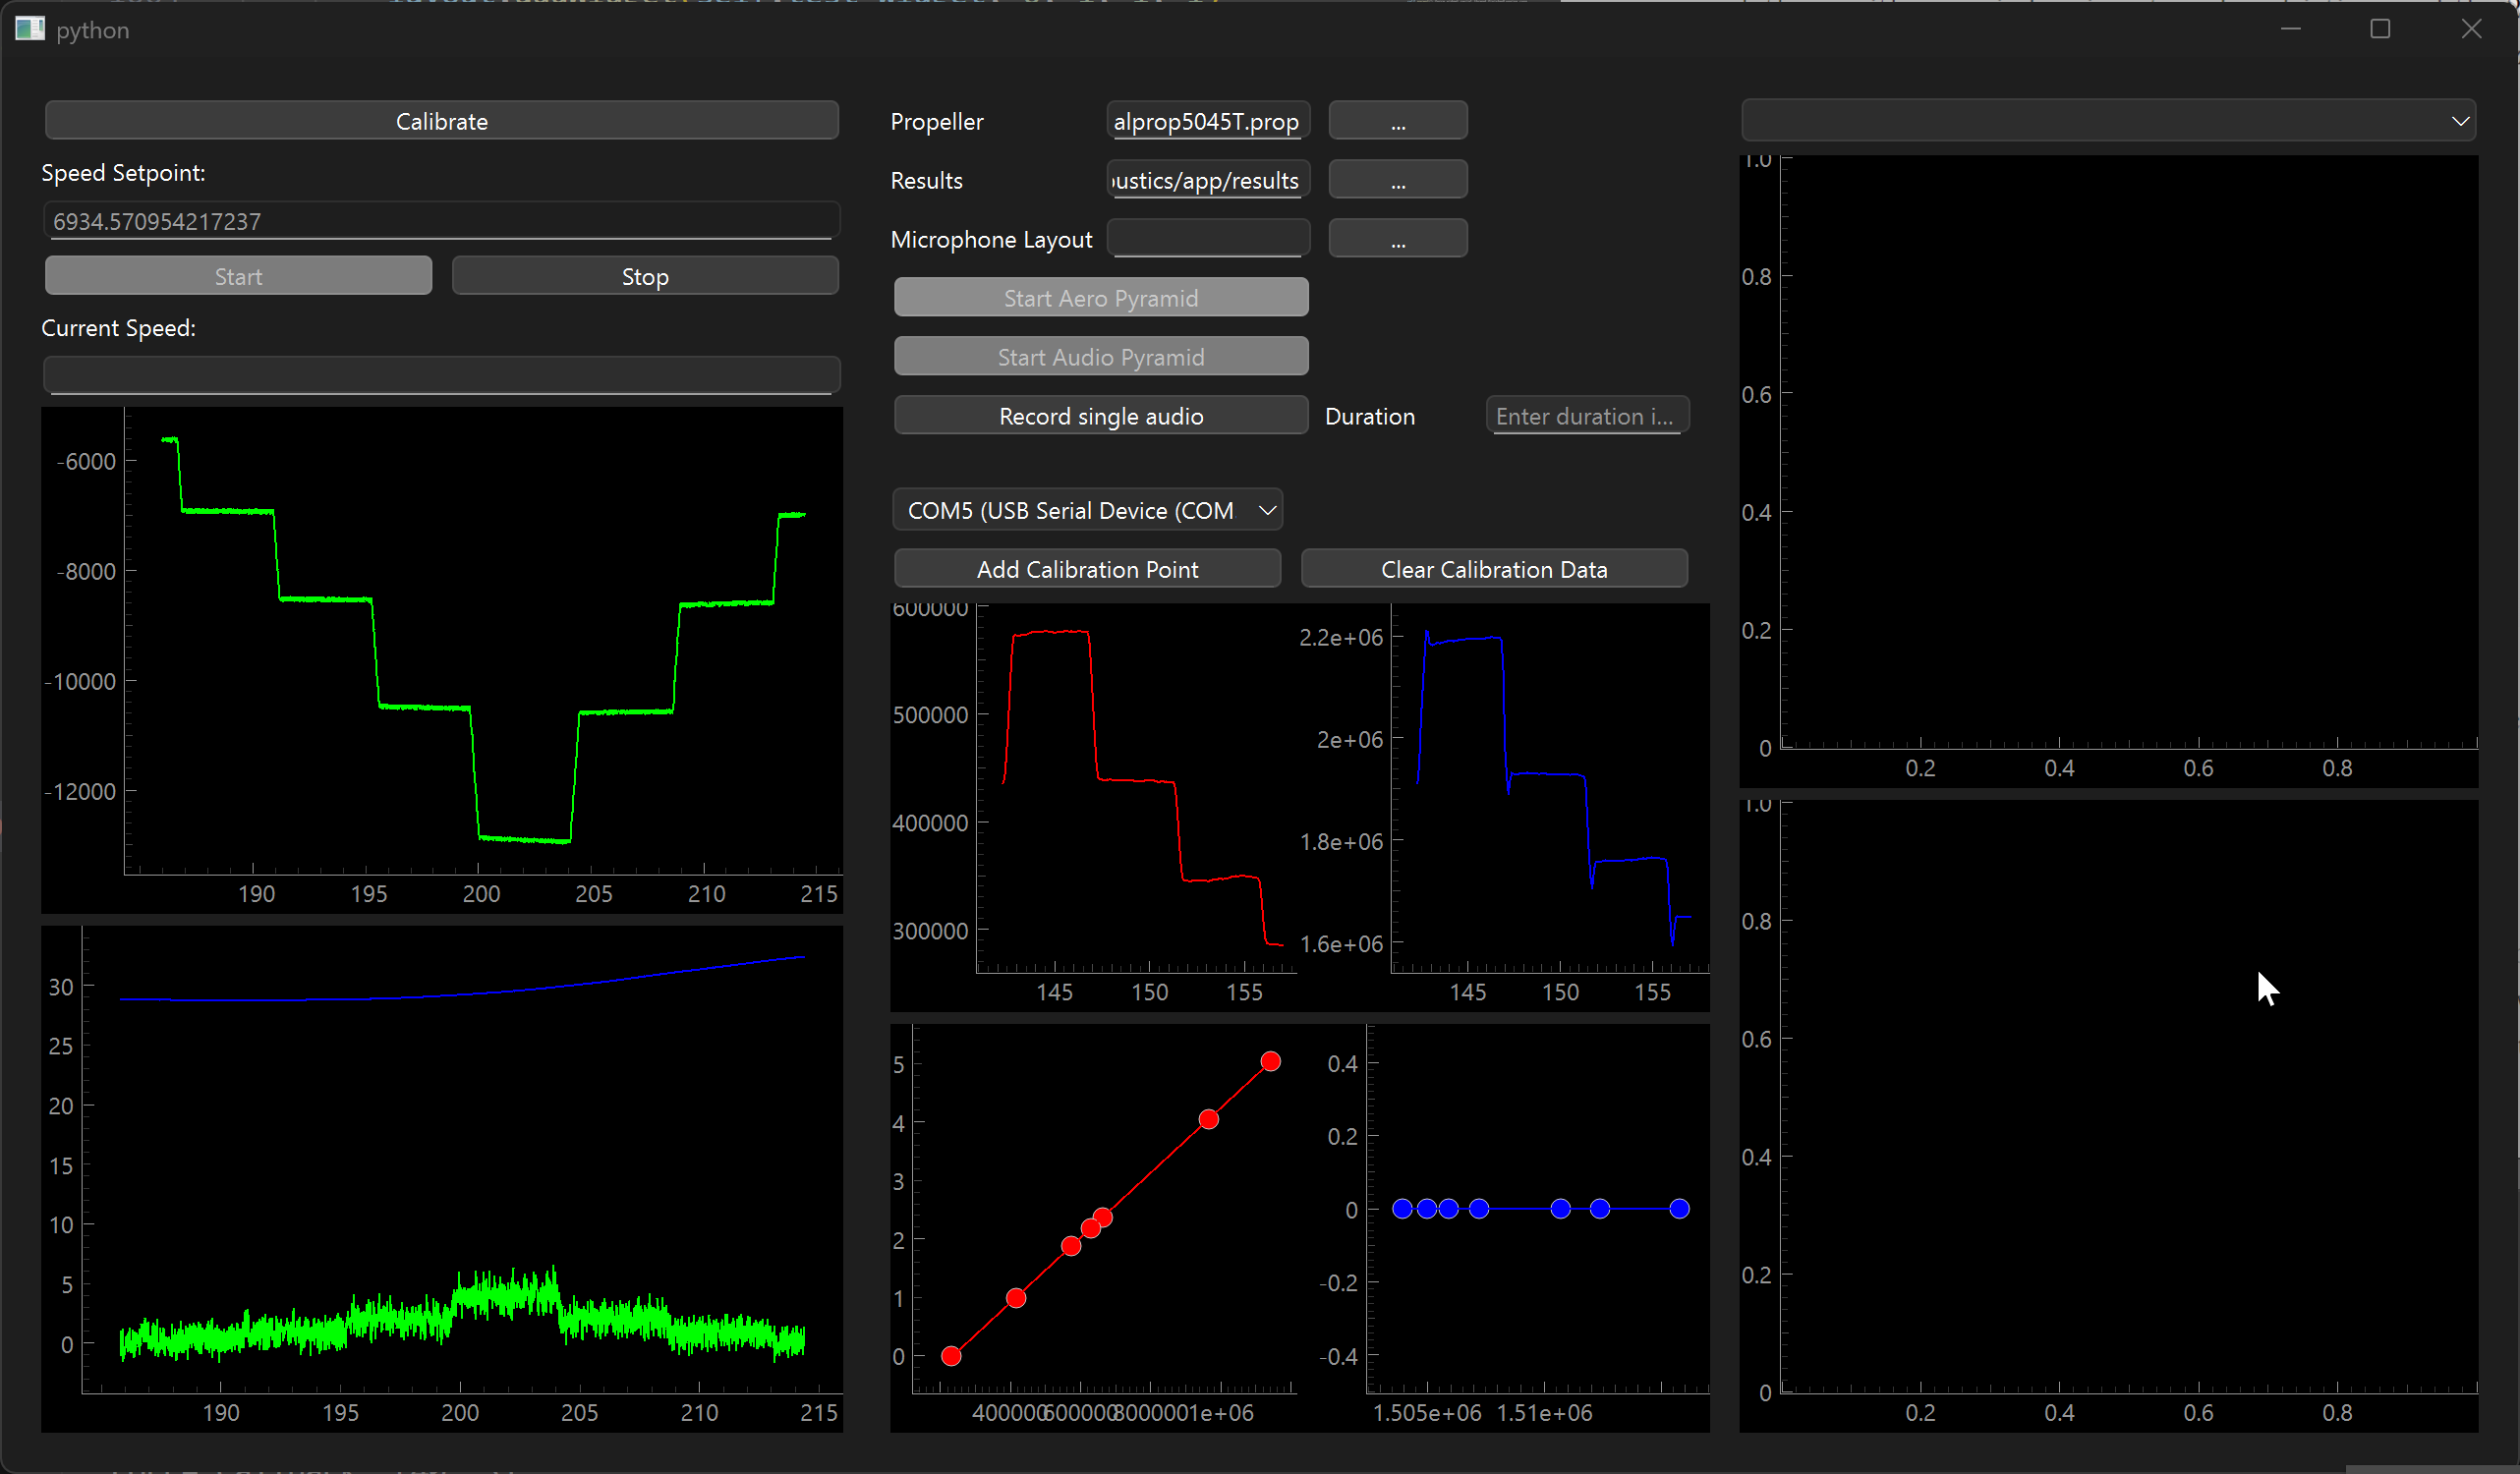
- Data recording app to sample several microphones simultaneously and safely control the setup remotely.
- Propeller design app in which a propeller is defined by airfoil shape (UIUC), chord, twist, and sweep distributions as well as number of blades and diameter (and additional less important parameters).
- Calibration of load cells and applying manufacturer-specified frequency-dependent sensitivity for each microphone.
- Filtering, aggregating, and plotting data spanning several variables (propeller, spin speed, microphone distance, microphone angle, harmonic number).
- Bar graph image ticks generated by contrast-contour detection of photographed propellers.
- 36 page technical writeup including literature review, theory behind proposed comparative metric, experimental setup, results and conclusions.
- Beamer presentation summarizing the project and results delivered to the fluids group professors and fellow students.
